Where was it?
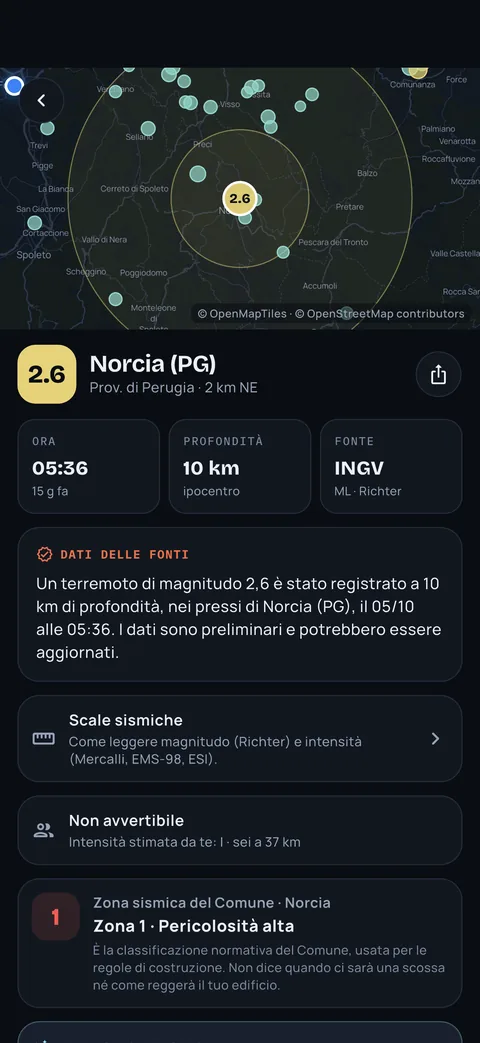
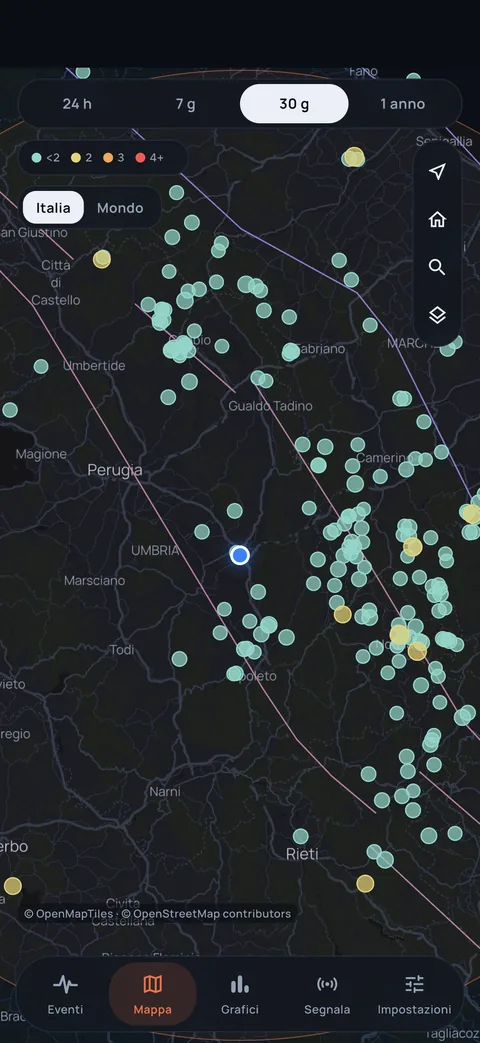
Epicentre and depth on a map you read at a glance, with the nearest town.
INGV, USGS and EMSC data explained in plain words by an AI, the estimated intensity at your home and an emergency mode that works even without a network.


Free for the essentials, no account. iPhone, Android, Apple Watch and Wear OS.
Independent, unofficial service. It does not predict earthquakes.
Real app screens with sample data.
Updated 15:52. The strongest quake was recorded yesterday at 15:52.
In the first minutes, different numbers and unverified news circulate. Epicentro shows only what the sources have published, with the time next to it.
Epicentre and depth on a map you read at a glance, with the nearest town.
Magnitude, estimated intensity in your town and what it means in practice.
Distance from your town and the areas you follow, already calculated.
For every quake you see the source data and, in a separate box, a clear explanation: how it felt, whether it is normal for that area, what to expect in the hours after. Pick an example and watch it write.
A light quake, only 3 km deep. Near the epicentre many people felt it as a sharp jolt or a short vibration. Quakes of this size rarely cause damage. Smaller aftershocks may follow in the next hours.
It may contain errors: when in doubt, the source figure prevails.
Illustrative examples. In the app the explanation comes with every quake, in your language.
Magnitude is a single number; intensity changes with distance. Epicentro estimates how much the ground shook where you are and shows your town's seismic zone. Move the sliders and see the difference.
Indicative estimate using an empirical attenuation relation and an 8 km depth: it does not replace official surveys. In the app it is computed for your home and the areas you follow.
Some people indoors feel a light vibration.
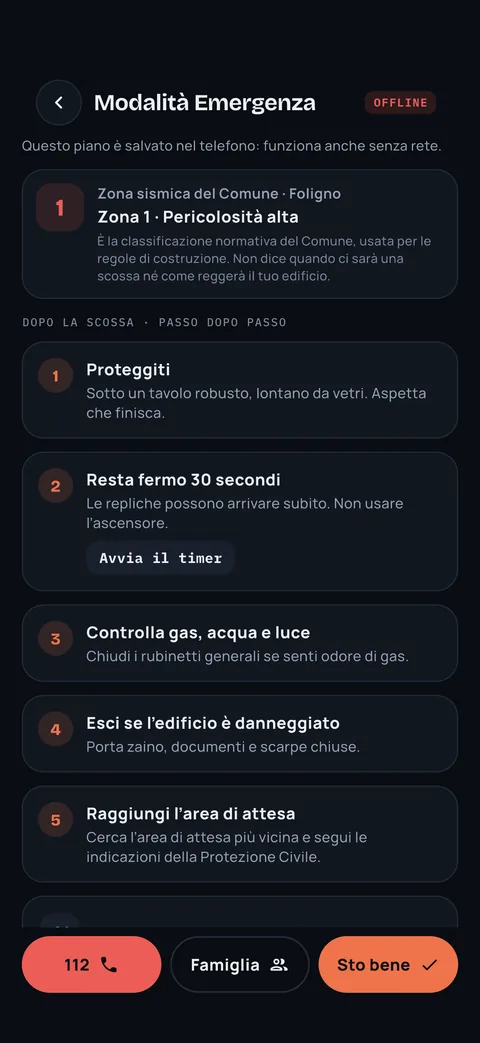
Emergency mode is already saved on your phone: what to do step by step, nearby assembly areas and hospitals, 112 one tap away. Try switching the network off in the box: everything stays there.
Illustrative example. In the app, areas and hospitals are the ones near you, with OpenStreetMap data saved on your phone.
Move the radius and choose the minimum magnitude: see how many sample quakes would fall within your alerts.
An optional experiment. A phone that is still and charging can pick up the first waves and send an anonymous signal; the server compares it with nearby phones and discards isolated signals, such as a dropped phone. Today it sends no alerts, and we say so plainly.
Illustrative simulation. Today the Network is an experiment: it sends no alerts and does not predict earthquakes.
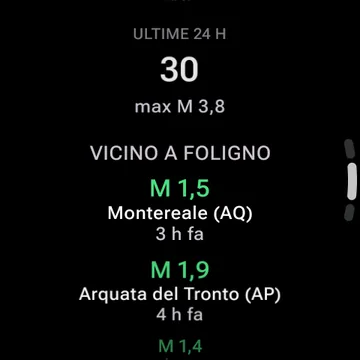
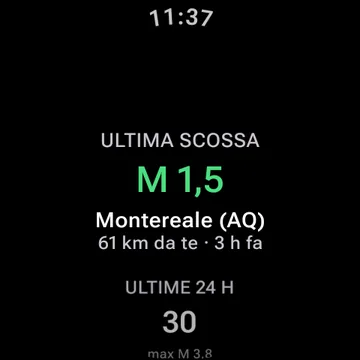
A widget with the latest quake near you and an Apple Watch and Wear OS app designed for a single glance.
Basic safety alerts always stay free. Plus is for people who want to go deeper or follow more people and areas.
Always free, no account needed.
Optional subscription for more tools.
Price and free trial as shown by the store.
Every quake shows its source and update time. If the source revises a figure, you see it change with the note “Subject to revision”.
No. It is an independent service: it is not part of Civil Protection or INGV. For official guidance follow the authorities and, in an emergency, call 112.
No, and no service can. Epicentro shows what happened when the sources publish it, plus statistical estimates, such as estimated intensity and, with Epicentro Plus, aftershock probability, that are not predictions.
From INGV for Italy, USGS for the rest of the world and EMSC as a backup. Next to every figure you find the source and time, and you can see if it was revised.
It depends on when the source publishes the event and how your phone delivers the notification. The alert arrives after the quake, never before, and can be delayed.
The core is free and works without an account: basic alerts, events, map, summary and “I felt it”. Plus is optional; price and free trial are as shown by the store.
Get Epicentro and choose which quakes you want to know about. Basic alerts are free and you do not need an account.
Epicentro is independent and unofficial. It does not predict earthquakes.